Join our FREE WhatsApp Broadcast List to get all Updates, Levels and News right in your mobile phone. Just Give us a miss call on 08160502696 now!!

Showing posts with label CALL. Show all posts

Friday, August 9, 2019

Outlook on Bullion, Metals and Energy Levels 9th Aug 2019


Gold traded sideways on Thursday after a gap up opening on the expectation that the US and China trade talks are not going to resolve any soon which create concern about the global economy due to which traders are moving towards Gold for the investment.
Crude oil traded higher on Friday on the expectation that OPEC members will cut more the output which is supporting the price of Crude but on the other hand trade the dispute between the US and China working as resistance in the growth the demand.

Technical Levels


GOLD


Image result for gold


Support is at 37800 and resistance is at 38000. 
Break and sustain above 38000 will take it to 38200--38400 marks or else it could touch its support level of 37700 again
Fresh selling can be done on a close below 37800 levels               
 Trade with levels only

SILVER

Image result for silver

Support is 42700 and Resistance is 43800 Break and sustain above 43800 will take it to 44300---44500 marks or else it could touch its support level of 42700 again
 Fresh selling can be done on a close below 42700 levels 
Trade with levels only


CRUDE OIL


Image result for crude oil


Support at 3690 and Resistance at 3790. 
Break and sustain above 3790 will take it to 3850—3900 marks or else it could test the support level of 3690 again. 
Fresh buying will do on a close and sustain below 3690 marks.
Trade with levels only.


NATURAL GAS

Image result for NATURAL GAS


Support at 147 and Resistance at 152. 
Break and sustain above152 will take it to 157—160 marks or else it could test the support level of 147 again. 
Fresh selling will do on a close and sustain below 147 marks.
 Trade with levels only.


COPPER

Image result for COPPER

Support at 440 and Resistance at 444.
Close and sustain above 444 will take it 448—450 or else it could touch its support level of 440. Fresh selling will do on a close below 440.
Trade with the levels only.


NICKEL

Related image

Support at 1090 and resistance at 1140.
Trade within the range and wait for the confirmation. The major trend is positive.


ZINC AUG

Related image


Support at 183 and Resistance at 185.
Break and sustain above 186 will take it to 188—190 marks or else it could touch its support level of 183. Fresh selling can be done on a close and sustain below 183.
Trade with the levels only.


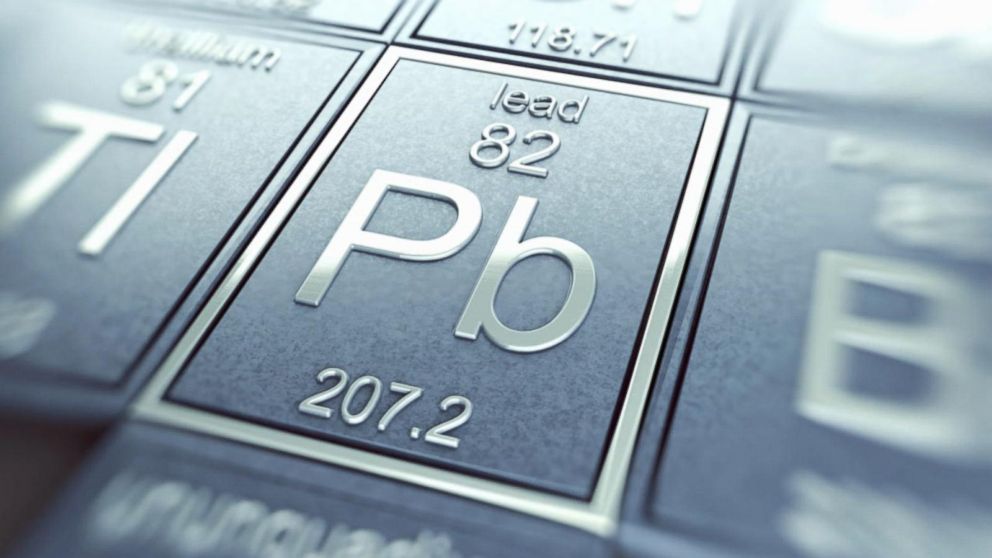
LEAD AUG


Image result for LEAD

Support at 154 and Resistance at 156 
Break and sustain above 156 will take it to 158---160 marks or else it could touch its support level of 154 again 
Fresh selling will do on a close and sustain below 154 levels.
Trade with the levels only.


Tuesday, February 19, 2019

Ashok Leyland Can Bounce 30% up From CMP


Ashok Leyland (NS: ASOK) has trapped many investors. Relief will be seen in a few days.
The company had very fewer competitors which helped it to sell it's all inventories with good margins a few years back. But now many international companies have entered the Indian market who were the leaders in their respective countries. The innovation in the new entrant’s vehicles helped them grow fast. So, years back it had stretched valuations. Now, the stock came near its "fair value" and due to uncertainty in metal prices and other factors that affected the entire automobile sector, the stock plunged even more.


Outlook:- Ashok Leyland has more chances of bouncing back than ever. On the above chart, you can see, the stock is near its very strong support of 75. We expect it can bounce 30% from here to level 100 and 8-10% bounce can happen in a few days. It has formed "Head and Shoulder" pattern during its fall and its sell target (from that pattern) is also completed. So, the bounce is more likely. You can see the stock has taken support 4 times from the level (shown by rectangles).
Investors can average their positions at this level.
Positional and Short-term traders also can take fresh buy position with a stop-loss of 73 (closing basis).
Fundamentals obviously have not changed the stock, but this has been a good "demand zone" for long time investors and huge buying will surely come near these levels.
Mutual funds and elite investors usually search for stocks like this. Ashok Leyland at this level will be the best trade for "value investors", who look to buy stocks of reputed companies during their bad days, available at discounted prices.
Hedging Benefits:- The "Head and Shoulder" pattern (our most trusted pattern) was formed and long-term investors hedge their positions by selling for short-term in futures, to make money from that fall also. So, those investors will wind-up those shorts and huge short-covering will give additional bounce to the stock. While retail investors don't have hedged positions and they think of averaging by buying on every low, instead of for selling them in futures. That is mainly because they don't see the technical patterns, while elite investors obviously excel technical analysis and take benefits from such falls too.
Disclaimer:- Investors and traders must consult their financial advisor before making any trading or investing decisions.
We hope this helps our readers.